This is a guest post from my colleague Filipe Sousa from DevScope who will share is very recent findings in automating management tasks in Azure Analysis Services, take it away Filipe:
Recently we came across the need to use one of the newest Azure services – Azure Analysis Services (AS). This lead us to an awesome Software as a Service (SaaS), dazzling query speed, stunning scalability…and a new administration paradigm, administer SaaS in the cloud.
Since Azure Analysis Services is charged hourly and we know that we will not use the service 24/7, how could we automate the pause/resume feature of the Azure Analysis Service so that we could optimize savings?
Couldn’t be more straightforward, except for some lack of documentation/examples, thanks Josh Caplan for pointing us in the right direction: Azure Analysis Services REST API
First, and so that the REST calls to the ARM API can be authenticated, we need to create an app account in the Azure AD. This can be done manually, as a standalone act or, better yet, as part of an Azure Automation Account with a Run as Account creation. The last will deploy a new service principal in Azure Active Directory (AD) for us, a certificate, as well as assigns the contributor role-based access control so that ARM can use it in further runbooks.
Recap, we will need:
An Azure Automation Account so that we can have:
· Runbook(s) – for the exercise, specifically a powershell runbook;
· A run as account so that the script can authenticate against Azure AD;
· Schedules to run the runbook.
This is how you can achieve it:

(If you already have automation account and don’t have a run as account, create an Application Account in Azure AD.)
Having created the azure automation account, we can peek at the new run as account with the service principal already created for us:
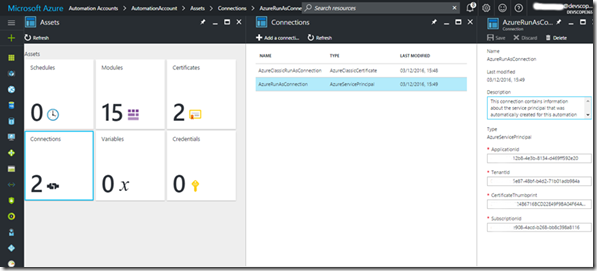
Additionally, we can take the opportunity to gather the application, tenant and subscription id’s, it will serve us latter.
Having the Automation Account in Place is time to create a key for it, go to your app account in Azure AD, in the all settings menu select keys and create a new key with the desired duration. Copy the key value and save it somewhere safe, you won’t be able to get it later!

For now, all we have to do is to collect:
· ApplicationID: in Azure AD –> App Registratons –> The name of app we just created
· Application Key: Collected from the previous steps
· TennantID: Azure Active Directory –> Properties –> Directory ID value
· SubscriptionID: From the Azure URL: https://portal.azure.com/#resource/subscriptions/e583134e-xxxx-xxxx-xxxx-bb8c398a8116/…
· Resource group name: From the Azure URL: https://portal.azure.com/…/resourceGroups/xxxResourceGroup/…
· SSAS server name: Analysis Services -> YourServerName
Having those, replace this values in the below script and save it somewhere for now – we encourage you to develop and test your powershell scripts in powershell IDE –, and yes, this script will also work in an on-premises machine.
#region parameters
    param(
            [Parameter(Mandatory = $true)]
            [ValidateSet('suspend','resume')]
            [System.String]$action = 'suspend',

            [Parameter(Mandatory = $true)]
            [System.String]$resourceGroupName = 'YouResourceGroup',

            [Parameter(Mandatory = $true)]
            [System.String]$serverName = 'YourAsServerName'
    )
#endregion


#region variables
    $ClientID       = 'YourApplicationId'
    $ClientSecret   = 'YourApplicationKey'
    $tennantid      = 'YourTennantId'
    $SubscriptionId = 'YourSubsciptionId'
#endregion


#region Get Access Token
    $TokenEndpoint = {https://login.windows.net/{0}/oauth2/token} -f $tennantid
    $ARMResource = "https://management.core.windows.net/"

    $Body = @{
            'resource'= $ARMResource
            'client_id' = $ClientID
            'grant_type' = 'client_credentials'
            'client_secret' = $ClientSecret
    }

    $params = @{
        ContentType = 'application/x-www-form-urlencoded'
        Headers = @{'accept'='application/json'}
        Body = $Body
        Method = 'Post'
        URI = $TokenEndpoint
    }

    $token = Invoke-RestMethod @params
#endregion


#region Suspend/Resume AS -> depending on the action parameter

    #URI TO RESUME
    #POST /subscriptions/{subscriptionId}/resourceGroups/{resourceGroupName}/providers/Microsoft.AnalysisServices/servers/{serverName}/resume?api-version=2016-05-16

    #URI TO SUSPEND
    #POST /subscriptions/{subscriptionId}/resourceGroups/{resourceGroupName}/providers/Microsoft.AnalysisServices/servers/{serverName}/suspend?api-version=2016-05-16

    $requestUri = "https://management.azure.com/subscriptions/$SubscriptionId/resourceGroups/$resourceGroupName/providers/Microsoft.AnalysisServices/servers/$serverName/$action ?api-version=2016-05-16"

    $params = @{
        ContentType = 'application/x-www-form-urlencoded'
        Headers = @{
        'authorization'="Bearer $($Token.access_token)"
        }
        Method = 'Post'
        URI = $requestUri
    }

    Invoke-RestMethod @params

#endregion
With the powershell script assembled – note that one of script parameters is the action (suspend/resume), that we want the script to execute against the SSAS – the next steps are:
· Create a runbook within the early created automation account with the type powershell, paste the previous script, save it and…voilà, ready to test, publish and automate!

· Next step is to publish the runbook so that it can be used in a schedule, fully automating the suspend/resume procedure. After publishing the runbook, create/assign it schedules – one to suspend and other to resume the AS server:

Afterwards configure the desired script parameters for each schedule:
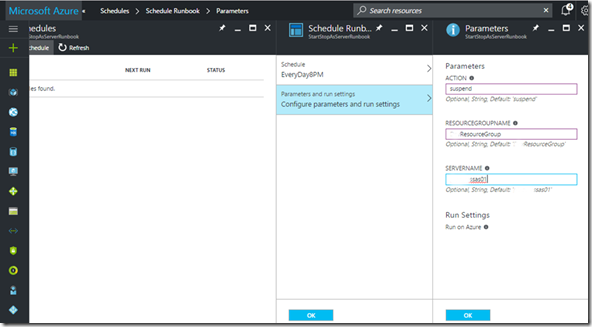
The final result should look like this and give us the desired suspend/resume Azure AS automation.

Hope that you’ve learned from our post, have a nice Azure automation, leave your comments below!
Filipe Sousa




![clip_image002[5] clip_image002[5]](https://ruiromanoblog.files.wordpress.com/2017/05/clip_image0025_thumb.jpg?w=244&h=135)


![clip_image002[7] clip_image002[7]](https://ruiromanoblog.files.wordpress.com/2017/05/clip_image0027_thumb.jpg?w=587&h=227)
![clip_image004[4] clip_image004[4]](https://ruiromanoblog.files.wordpress.com/2017/05/clip_image0044_thumb.jpg?w=593&h=97)
![clip_image006[4] clip_image006[4]](https://ruiromanoblog.files.wordpress.com/2017/05/clip_image0064_thumb.jpg?w=551&h=234)

